Today we’re introducing a new software tool: Staffing Navigator™! This tool is intended to help operators understand how acuity, number of residents, nursing rates and mix (RN, LPN and CNA) work together to determine your staffing stars. Additionally you can use Staffing Navigator™ to:
-
Determine the ideal mix of RN, LPN and CNA to achieve any star level
-
See how close you currently are to the next highest (and lowest) star
-
Understand how the acuity and caseload of ANY facility compares to any other
-
See how many additional (or fewer) nursing hours it would take to hit any staffing level
-
Run complex nursing staffing scenarios
-
See acuity, number of residents and staffing levels for any facility in the US!
In the remainder of this posting I am going to explain in detail how to use this tool. But before I do that, let me just say: This is an advanced tool intended for users who understand staffing planning, star ratings, hourly and fully loaded nursing rates. It is a tool we use to help people understand what it would take to improve star ratings. You may need additional training to effectively use this tool. (Let me know if you’d like to do some private training using this new tool.)
If you’re still interested, great! Let’s get started. First things first, download Staffing Navigator™ from your app store. (Yes, it is free!, Spread the word!) Click one of the links to the right to install it.

A tour of Staffing Navigator™
Now that you’ve installed and before I explain how to use it, let’s take a tour of the interface.
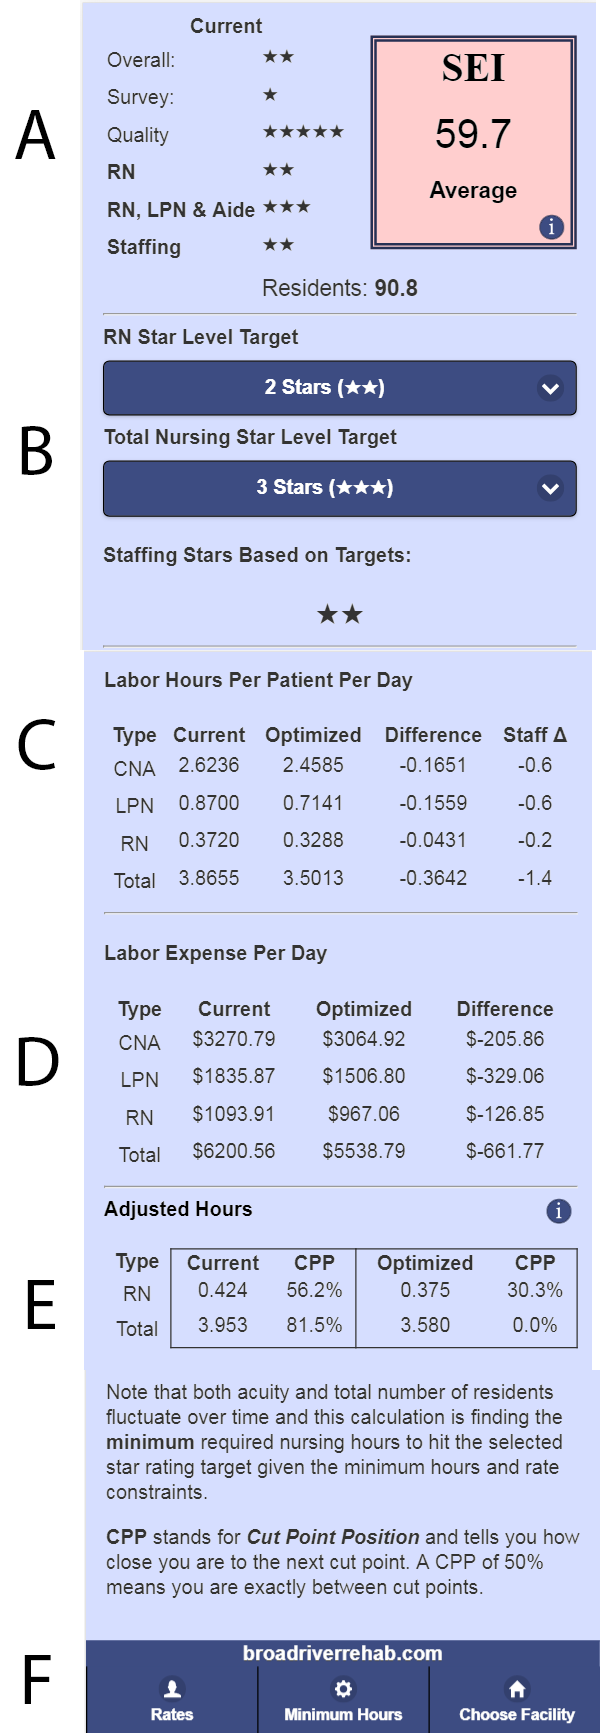
Once you have selected a facility, you will see the screen to the right. Note the letters by each section.
Current Ratings (A Left)
The current ratings are taken directly from the Nursing Home Compare website. This information is for reference and does not change as you work on different scenarios.
SEI (A Right)
SEI is a metric developed by Broad River Rehab. It tells you how difficult it will be for this facility to change star ratings compared to all other facilities in the country. An SEI of 50.0 would mean that half the SNFs in the country are more costly to change staffing star ratings and half are less.
SEI takes into account both acuity and number of patients. The higher either of these, the more expensive it will be to increase your staffing star rating. You can touch the box for more information on SEI.
Targets (B)
We’ll cover the targets much more in depth later. For now, just understand that when you first select a facility, these will both be set to you current staffing ratings. Note that the small star(s) under the dropdowns tell you what your staffing star rating would be if your staffing ratings matched the dropdowns.
Labor Hours (C)
The labor hours section shows you the current actual labor hours per patient per day for the three nurse types. The next two columns show you the optimized hours and the difference between optimized and current hours. (Much more on optimization later.) The last column shows you the increase or decrease in staff to get to the optimized level of staffing.
Labor Expense (D)
Labor Expense (highlighted) shows your current labor expense based on actual hours reported and the rates you have configured. (More on rates later.) Like the labor hours section, this area shows you the difference between your actual hours and optimized hours.
Adjusted Hours (E)
The adjusted hours (not highlighted) show you current and optimized adjusted hours as well as how close you are to the cut points. If CPP equals 50%, that means you are exactly centered between the cut points for the current staffing level. Likewise, if CPP is 99%, you are very close to the next star rating.
Minimum Hours & Rates (F)
These will both make more sense to discuss as we talk about optimization, but the navigation buttons are at the bottom of the screen. For now we’ll just say that you can configure rates and minimum hours to do many different types of analysis.
Let’s move on to actually using Staffing Navigator™!
How to use Staffing Navigator™
Okay, let’s get to some usage examples. Select a facility on your app and follow along. I would only caution you that selecting a one-star overall facility can be misleading: if the survey score is one then the overall is going to be one regardless of other factors. Likewise, facilities with an RN rating of one can be confusing as well. Make sure you have a good understanding of the star rating rules before you study edge cases.
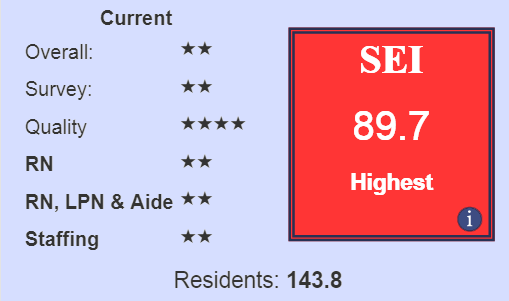
I’m using this facility for my example. It’s got 2 overall stars with a two rating across the board for staffing. The SEI is 89.7 which means this building has high acuity, a relatively high number of residents and it’s going to be expensive to increase the star rating.
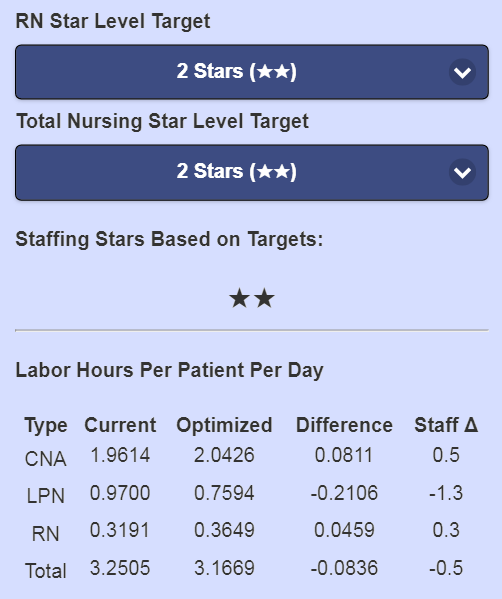
Scrolling down, we can see the optimizer is suggesting changes to all three nursing types. Although we haven’t changed the RN and overall staffing targets, the hours can are still optimized for the current star rating, based on the minimum nursing hours and the rates, both of which can be configured to your needs.
The rates are straightforward and easy to understand. By default the rates are set to national average rates from the Bureau of Labor Statistics. More on these later.
The minimum nursing hours are a little more complicated. CMS publishes something called case-mix hours which are essentially the hours CMS expects to see given the reported acuity of the residents in the building. (These used to be called expected hours but have recently been changed to case-mix hours.)
By default, Staffing Navigator™ uses these case-mix hours as the minimum hours for each nursing type. You can see in my example facility both RN and CNA hours are less then than the case-mix hours so both were increased. LPN hours are higher than case-mix targets so LPN hours have been reduced. (I’m oversimplifying here. There are actually a few more things going on, but you get the idea.)
You can easily change the minimum hours to the actual hours, which will cause the optimization not to reduce any hours. Use this if you don’t want to reduce hours or staffing. Just keep in mind that you aren’t really optimizing at that point, but the tool will do whatever you ask. This technique is useful if you want to simply reach the next star level and you aren’t as concerned about the cost.
You can also reduce the minimum hours to zero, but beware: star ratings favor RNs, and CNA rates are typically lower than LPNs. If you set the minimums to zero you will not get any LPN hours. This isn’t a bug, it’s just the natural outcome of star rating rules and the economics of nursing.
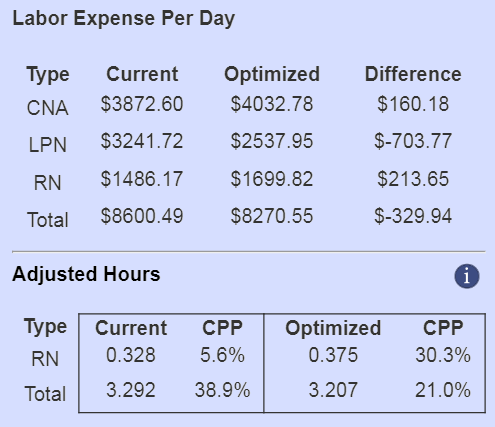
Based on this optimization, you could save $329.94 per day while maintaining a two star rating.
Back to the rates: the default rates are national averages and are not fully loaded. I highly recommend you update these rates for your market and use fully loaded rates if you plan on using the labor expenses for more than just differential comparison.
Below that, you can see that initially the RN hours were 5.6% away from the lower cut point for 2 stars. A small upward change in overall acuity or an increase in residents will cause RN hours to fall below that cut point and result in an RN staffing rating of one which would drop this facility to one staffing star. This is a serious concern.
After optimization, you can see we have much greater room for fluctuations in acuity and occupancy. You will find this isn’t always the case when doing optimizations however, as we’ll see next.
Simulating an Increase in Staffing Star Rating
So for my example facility you can see we have two overall stars. For a lot of markets, having less than 3 overall stars will have a negative effect on Part A admissions so getting one extra overall star could be very important. We can get a bonus star by getting our staffing stars up to four and we want to know how much that would cost. This would help answer the question: “Should we focus on increasing staffing or improving quality measures?” (Note that for this building, an additional quality star would result in a bonus star as well.)
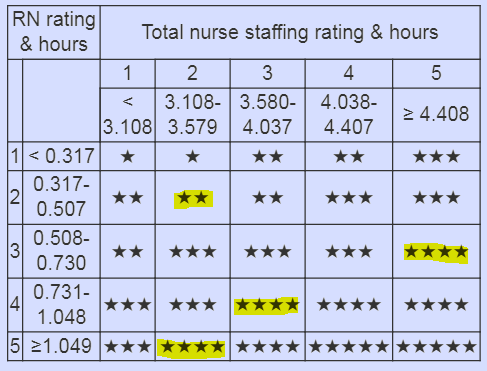
Our first hint should be the SEI of 89.7. That tells us right away that this is going to be expensive. The next thing to consider is what actions do we want to take. If you touch the blue circle or the section title “Adjusted Hours” you’ll see the cut point table. I’ve highlighted both where we are currently as well as three potential place we could go to get 4 staffing stars.
All we have to do now is change the dropdowns and compare the results. This type of analysis is called differential analysis: we don’t care about the exact dollar amounts, just which on is lowest. If we decide we’re actually going through with this, we would need fully loaded rates and we’d want to check facility acuity and caseload over time to see if this data accurately represents normal running conditions or is this quarter an outlier. In other words, this tool is pointing you in a direction only. Due diligence is important.
| Scenario | RN | Total | Change in Expense |
|---|---|---|---|
| 1 | ★★★ | ★★★★★ | $2,362.05 |
| 2 | ★★★★ | ★★★ | $1,330.37 |
| 3 | ★★★★★ | ★★ | $2,729.77 |
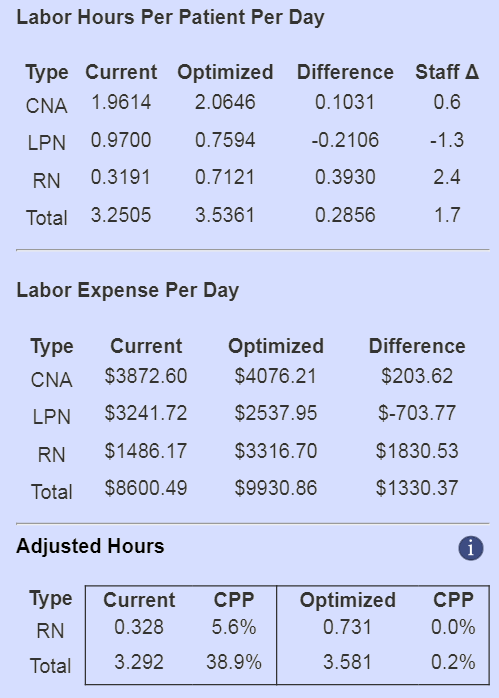
You can see that scenario 2 is the least expensive. Let’s take a closer look at the results.
We chose an RN rating of 4 and an overall rating of 3. You can see the optimized staffing changes to the right. We’d need to hire about 60% of a full time CNA for all shifts and a challenging 2.4 full time RNs for every shift. (You don’t need to spread those RN hours over all shifts, you just need the hours at some point during the day.)
You can see the optimization reduced the LPN headcount by nearly 1.5, which offsets the cost somewhat.
Speaking of cost, this is by no means inexpensive. Using national average rates, (again, not fully loaded) we’re looking at an increase of $485K annually.
Remember that SEI of 89.7?
Lastly, look at the adjusted hours. Notice that the optimizer hit the nursing target with minimal expense, which means you are very close to the lower cut point. If you were planning to implement this change, be aware that these are the minimum required hours to get the star rating. There is no margin for error built in.
Other Analysis
With a little practice and thought, there are hundreds of different scenarios you can do with this tool. You can also request private training sessions or custom analysis of your facilities.