Med A Census Navigator version 1.2.0 will be hitting the app stores in the next couple of days. This update adds re-hospitalization data to the app. We think this information is important because it may play a role in inpatient discharge decisions.
Let’s take a look at some examples:
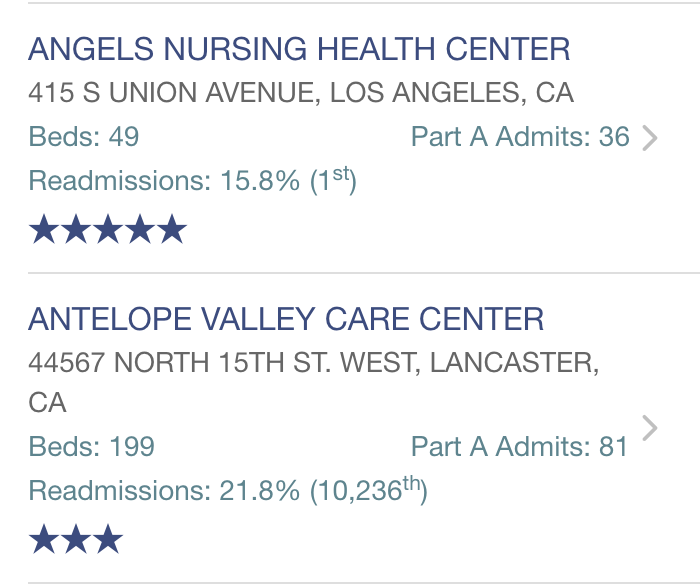
Here is an example of searching for a SNF. You can see we’ve added the readmission rate, 15.8%, for Angels Nursing Health Center in Los Angeles. The number in parentheses is the ranking of this facility compared to all others in the country. This facility is tied for first place.
You can see Antelope Valley Care Center has a readmission rate of 21.8%, ranking it in a tie for 10,236th, which is last place. Remember that your ranking is not based absolutely on your readmission rate. It’s based on your performance over your baseline. You will find cases where facilities with worse re-admission rates have better rankings than others with lower rates.
Also do keep in mind that these are risk adjusted re-admission rates.
This information will appear everywhere in the app where you see information about a SNF.
One thing to keep in mind: when you see a re-admission rate of 0, that means the facility did not have enough data to do the calculation. There are quite a few of those. They will rank tied at 2,910th.
If you aren’t familiar with Med A Census Navigator, you can read the blog announcement here, which includes links to the app store. We recently updated the app to show data from Q1 of 2020 and yes, it’s still free.
We would appreciate a rating in the app stores! We really hope you find this app useful.