I love Georgia peaches. In fact, I was lamenting that it was much too early for fresh peaches while at the GHCA winter convention a few weeks ago. (The peach cobbler was outstanding though.) The first bite of those famous southern summer peaches is a tasty treat.
Recently, we have been biting into some pretty tasty Georgia Medicaid case mix data. We here at Broad River Rehab love data. Understanding case mix trends help us support our clinicians to provide exceptional therapy. It also helps us support our customers by giving them a window into why their case mix is what it is and helps pave the road ahead for managing it successfully.
We have been serving Georgia since 2019. We work closely with our partners to make sure the CMI accurately reflects the care delivered and acuity of residents. The Medicaid rates reflect this.
Georgia Medicaid Q1 2022
Georgia DCS, as you may know, publicly posts every nursing facility’s Medicaid rate sheet every quarter. There are some really interesting stories buried within all those numbers. We’re going to dive in and take a look at the most recent two quarters of data and see what’s there.
Past cost reports determine much of the Georgia Medicaid rate. Currently cost reports from 2012 and 2014, as well as current CMI data determine the rate for this quarter, Q1. If a facility was recently purchased there can be exceptions however.
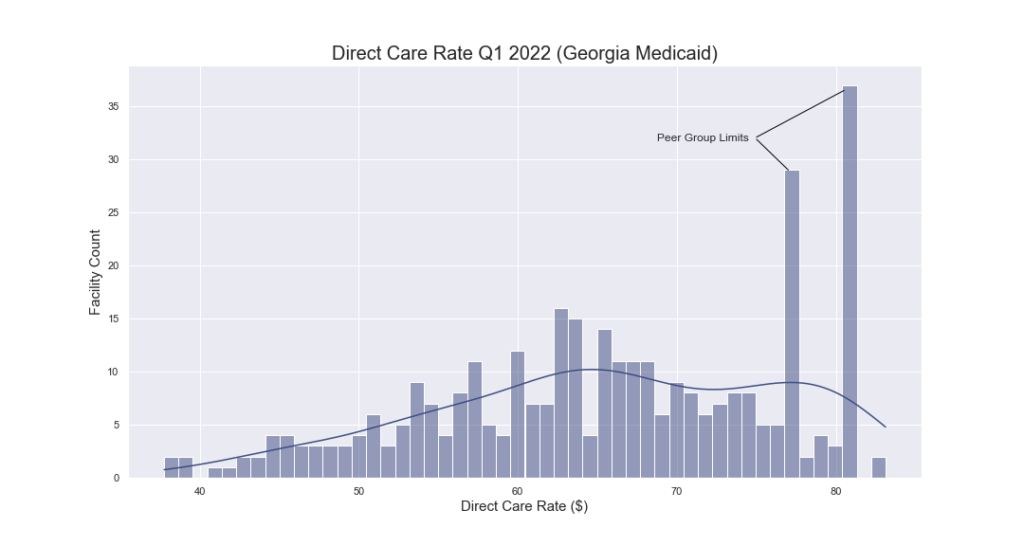
Peer Group Limits
Georgia assigns skilled nursing facilities to peer groups. Peer groups establish an upper limit on rates. When calculating the rate, the state takes the lesser of two items: the base period CMI and cost report and a percentage of your peer group. This is a cost limiting device.
It is interesting that some facilities have been able to spend money in accordance with the cost reporting rules in such a way that they have reached the maximum portion of the rate affected by the cost report represented in their routine services rate.
See the graphic below. Many facilities sit exactly at the peer group limits. Without this cost limiting device, these facilities would have higher direct care rates. The DCS Nursing Facility Services Policy Manual explains this in greater detail.
Routine Services
The routine services rate, determined by the cost report and a growth allowance percentage, is multiplied by the case mix index to determine that portion of the overall rate.
The case mix index (CMI) is a direct representation of a facility’s acuity as represented in the Minimum Data Set (MDS). The routine services allowed per diem, adjusted for growth allowance, is multiplied by the CMI.
For example, a facility with a growth allowance adjusted routine services rate of $65.83 can expect that for every 0.01 point increase in CMI, they would see a corresponding $6.58 increase in rate. If this facility had a CMI of 1.3847 then their CMI adjusted routine services portion of their Medicaid rate would be $91.15. (65.83 × 1.3847 = 91.15)
Monitoring is Key
MDS accuracy with regard to all that’s true about your resident population is critical. Missing resident characteristics and or services provided can have a significant impact on your rate.
The table below shows the overall change in CMI from the rate setting period for Q4 2021 (Q2 2021 MDS) and Q1 2022 (Q3 2021 MDS). There are 196 facilities out of 342, or 57% of all Georgia facilities that had a CMI drop from October 2021 to January 2022. 30% of facilities had a decrease in their CMI of 5% or greater. Many were 10% or greater.
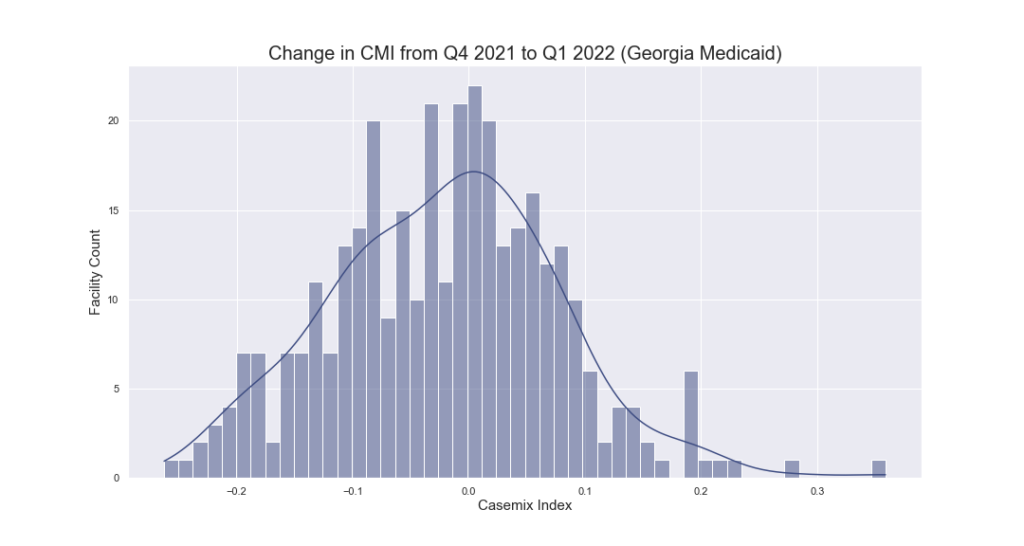
Obviously, COVID played a role. However, for example’s sake let’s use the facility numbers from above. (CMI: 1.3847, rate: 65.83, adjusted routine services: 91.15.) Suppose that same facility was to have a CMI improvement of 5%. That would be a CMI of 1.4539 resulting in a CMI adjusted routine services rate of $95.71 PPD. If that facility had a Medicaid census of 50 residents, that would result in nearly $21,000 of additional revenue for that facility in the next quarter. Small changes can make a big impact.
Case mix Distribution
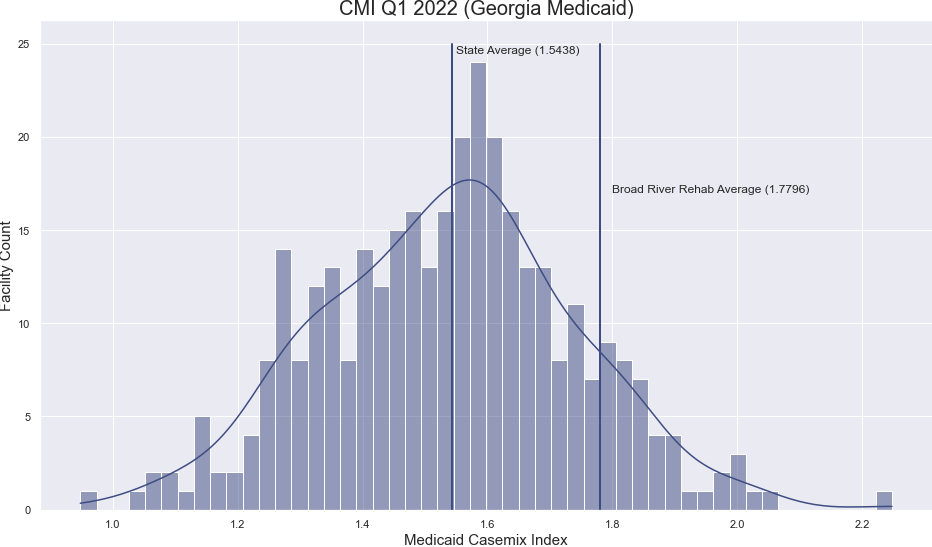
The graphic below shows the CMI spread for the January 2022 rate (Q3 2021 MDS). We have added a few benchmarks. You will notice first that the Georgia state average CMI for this period is 1.5438.
We also added a marker to show the Broad River Rehab average in Georgia, 1.7796. This represents a 15% improvement over the state average. If we apply the state average CMI to the average routine services rate of these facilities, $62.41, we get $96.34. If we apply that calculation to these facilities average CMI of 1.7796 we get $111.06. In other words, $14.63 PPD above state average.
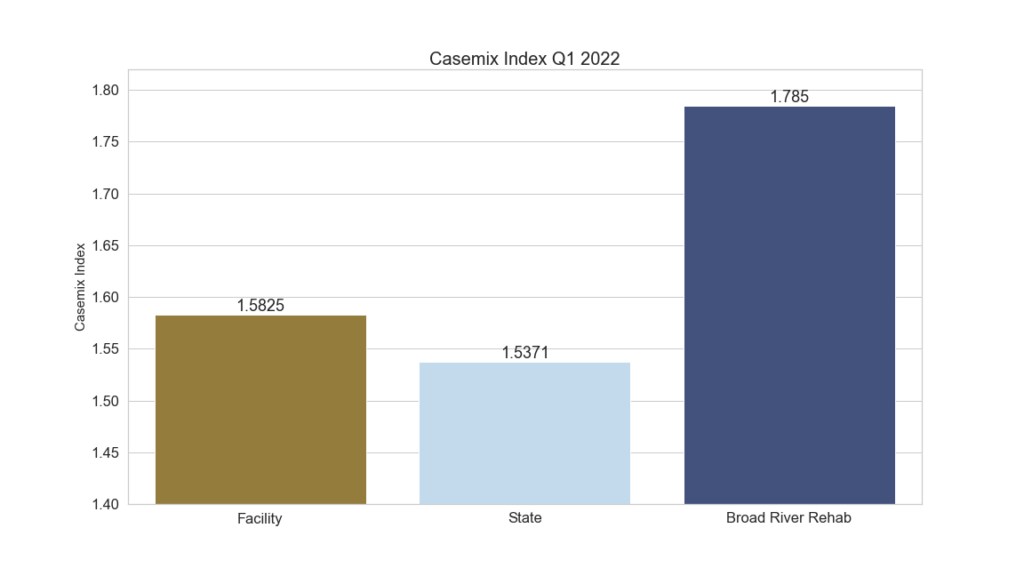
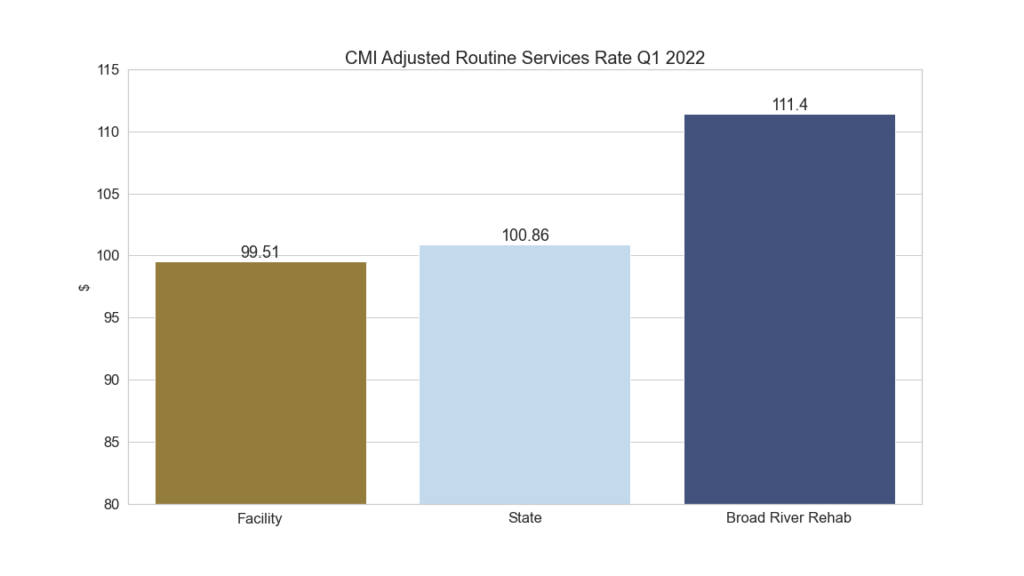
Facility Level Comparison
Here’s a more practical picture. Take a look at the data below. This data is available for all facilities in the state of GA. We selected a facility with a similar routine services rate so the dollar difference would be apples to apples. Note the difference in the CMI for the same time period makes a big difference in the rate. In this case about $12.00 ppd.
Additional Differences
There are other adjustments that are made to the routine services portion of the rate like percentage of residents who have a BIMS score of 5, nurse staffing hours and certain quality add-ons. These require attention to accuracy as well as they affect the rate after the CMI adjustment has been made. However, it is CMI that has the largest, direct effect. Attention to the CMI should be of primary concern.
Wrapping Up
Biting into this data is interesting and often rewarding. Knowing your CMI is essential to ensuring that you are not missing appropriate Medicaid reimbursement for your facility. Broad River Rehab monitors our partner CMI every day. We work with facility staff to be sure that Assessment Reference Dates are set appropriately to capture resident characteristics. Additionally, we strive to make sure the services provided are not missed when completing the MDS. Our CMI support shows in our Customers’ CMI and ultimately in their rates.
Contact Us
Please contact Jeff Moyers if you would like to see the change in YOUR CMI versus the state average.