It’s Christmas in July! All the waiting and anticipation is finally over. What’s under the tree though may not be what you anticipated. The gift we have been given this year sort of reminds me of the socks and t-shirts I used to get from my parents or that giant candy cane stick someone put in my stocking, blah! Somewhat useful but not the cool video games my friends got.
Our gift from CMS this summer yuletide is the July Care Compare update. It’s finally here! We have been waiting for this since CMS issues memo QSO-22-08-NH in January in which CMS announced its intentions to post weekend staffing and staff turnover data on Care Compare and to incorporate it into the 5-star rating. Then in early July we received the revised 5-star user’s guide. We anticipated much of the impact. However, now that the data is in, there are some not so nice surprises.
The Details
Let’s start with the reasons that the update has so many people talking. Two major changes have occurred to the staffing star scoring rules. First, staffing stars are now determined as the result of six staffing categories that have weighted points associated with them.
These six categories are Adjusted RN Staffing HRD, Adjusted total Nurse Staffing HRD, Adjusted Total Nurse Staffing on the Weekends HRD, RN Turnover, Total Nurse Turnover and Number of Administrator Departures. A cut point system with point values has been devised to award stars relative to national distribution. These measures are not equally weighted in their impact on a facility’s total possible points with RN and Total staffing accounting for 52% of the total possible score.
The unfortunate aspect to the July update using these measures is that they are primarily reflective of staffing patterns in 2021. We have detailed these measures and the staffing scoring methodology more thoroughly in a recent 5-Star Updates training on Broad River Rehab Insiders.
Within these measures a second major change has occurred, the inclusion of the weekend staffing and staff turnover data into the staffing star rating and the rule change that facilities must now achieve 5 staffing stars in order to add one star to a health inspection rating of 4 or less.
The impact these two changes have had are significant not only on the staffing stars but on the overall facility 5-star rating as well. Before the July update, the only measures that impacted the 5-star rating were the Adjusted RN staffing and adjusted total nurse staffing HRD. Facilities also only had to achieve a 4-star staffing rating to increase a health inspection rating of 4 or less.
Here are some hard facts from the July update.
Staffing Stars
- 32.4% of facilities lost one or more staffing stars
- 26.14% lost 1 staffing star
- 4.78% lost 2 staffing stars
- 1.13% lost 3 staffing stars
- 0.42% lost 4 staffing stars
Overall Stars
- 26 .37% of facilities lost one or more overall stars
- 22.28 lost 1 overall star
- 3.53% lost 2 overall stars
- 0.52% lost 3 overall stars
- 0.03% lost 4 overall stars
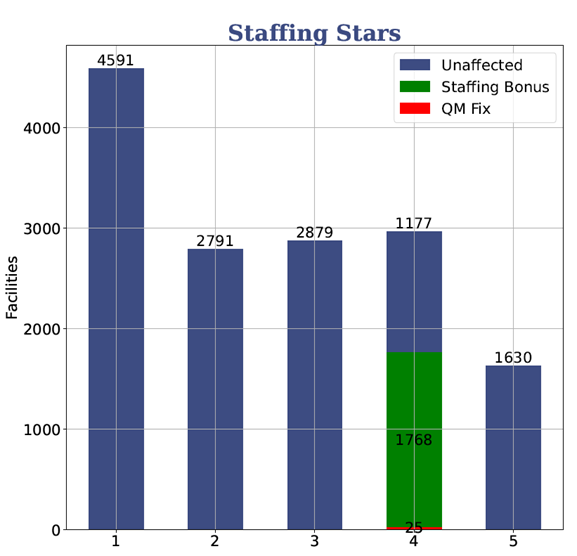
The singular impact of the rule change that requires 5 staffing stars to improve a health inspection of 4 or less is significant. The chart below shows more than 10% of facilities (11768) with a staffing rating of 4 AND their QM rating does not equal 5. Previously, these facilities would have added a star to their health inspection rating of less than 5. These facilities lost a star simply because of this rule change.
Notice also that there are 25 facilities with staffing rating of 4 that had a QM rating equal to 1. Previously these facilities staffing would have saved a star overall. Under the new rules these facilities will not save the star lost by the QM rating of 1.
What’s interesting is to look at the nationwide distribution of these measures to get a sense for the what the landscape looks like and how they stack up state by state. This data makes the star rating shifts noted above more understandable.
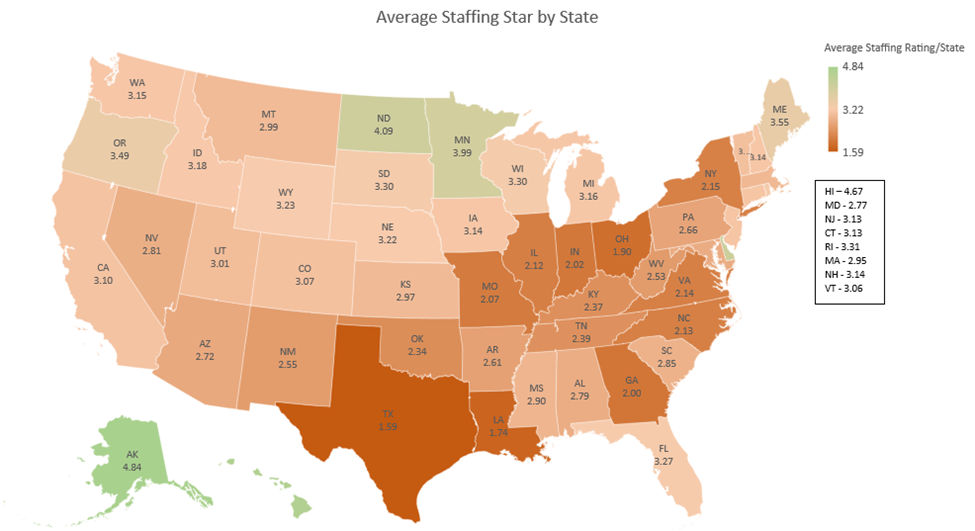
The following series of maps show the state averages for each of the 3 staffing and 3 turnover measures that are now utilized to calculate the staffing stars, starting with a map that shows the average total staffing stars by state which is reflective of the data on the other 6 maps.
Staffing Stars
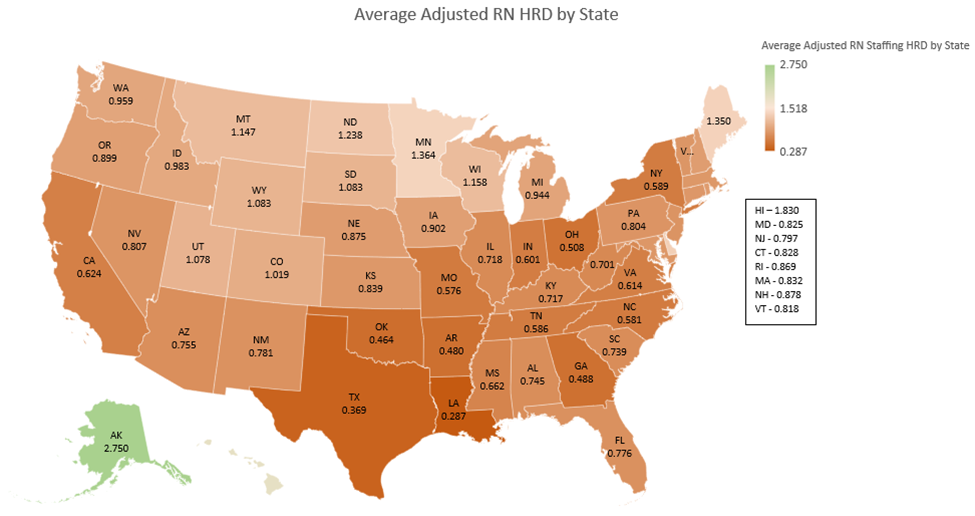
RN Hours
In the following map, you will see the average Adjusted RN HRD by state. Remember that adjusted staffing numbers reflect PBJ data as well as census and acuity data form the MDS. Greener states had higher average RN HRD. The “winner” is AK at 2.750, followed by HI at 1.830 RN HRD and Minnesota at 1.364
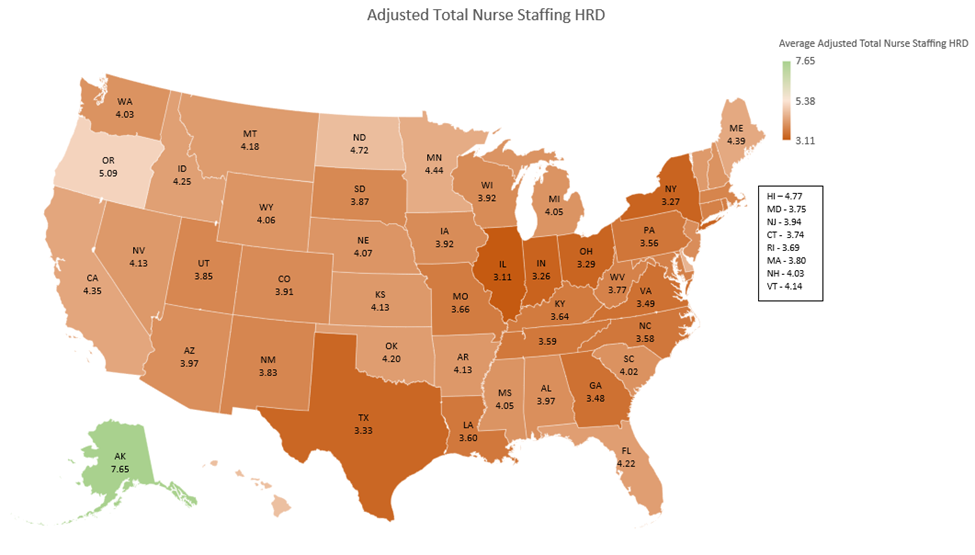
Total Nurse Hours
In the following map, you will see the average Adjusted Total Nurse (RN, LPN, CNA) HRD by state. Greener states had higher average total nurse HRD. The “winner” is AK at 7.65 followed by OR at 5.09 and HI at 4.77.
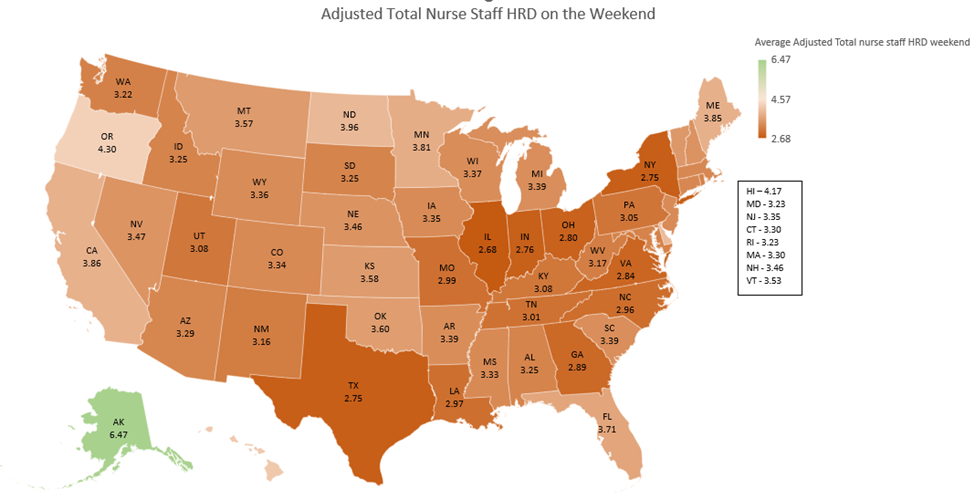
Weekend Hours
In the following map, you will see the average Adjusted Total Nurse (RN, LPN, CNA) HRD on the weekend by state. Greener states had higher average Total Nurse Staff HRD on the weekend. The “winner” is AK at 6.47, followed by OR at 4.30 and HI at 4.17.
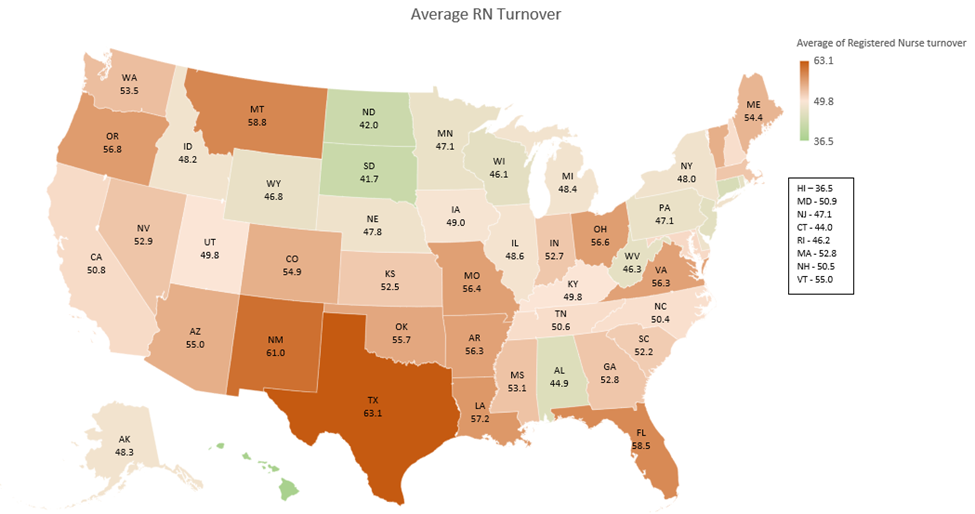
RN Turnover
In the next map, you will see average RN staff turnover by state. Greener states had lower RN turnover. HI had the lowest RN turnover at 36.5% followed by SD at 41.7% and ND at 42.0%.
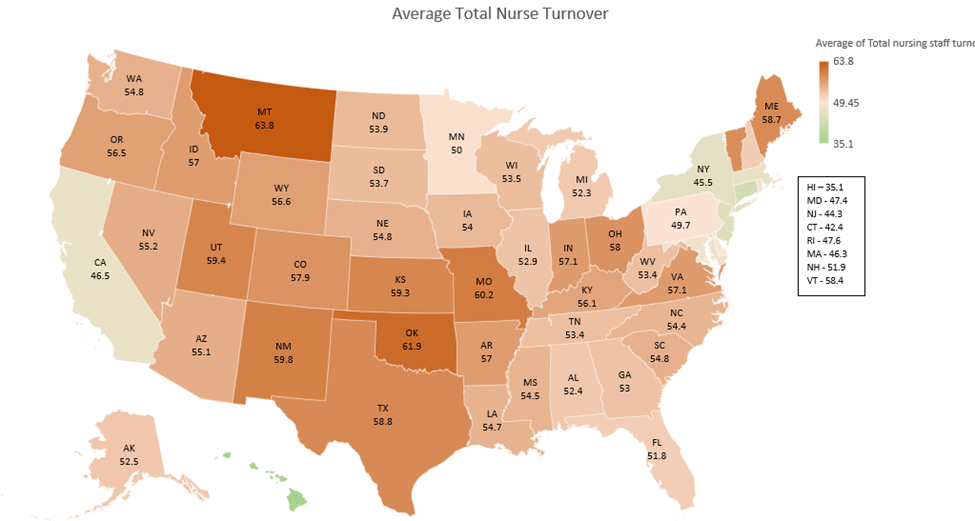
Nurse Turnover
The next map shows us total nursing staff turnover by state. This measure includes RNs LPNs and CNA staff. Greener states had lower total nurse turnover. HI again is the “winner” here with 35.1% total staff turnover, followed by CT with 42.4% and NJ with 44.3%.
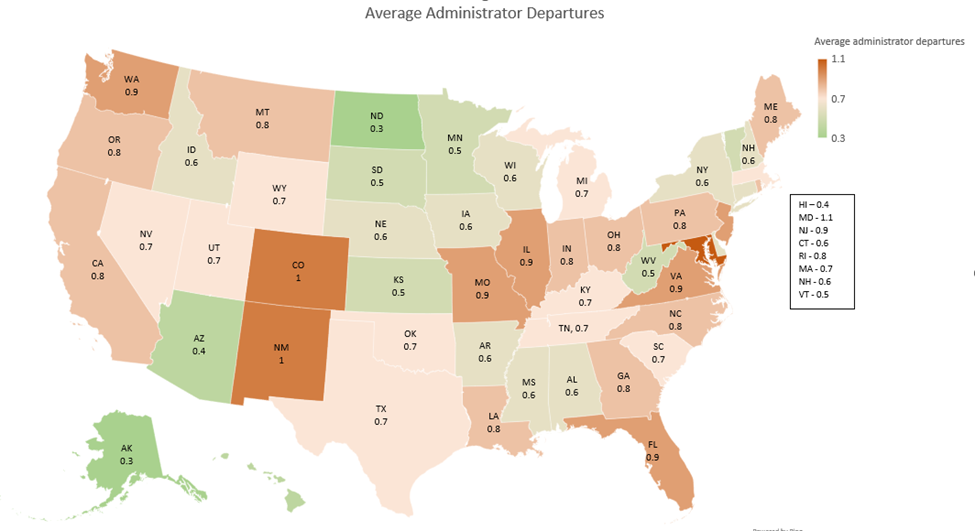
Administrator Departures
Rounding out the 6 staffing measures is average administrator departures per year by state. Greener states had lower administrator turnover. ND and AK are tied at 0.3%, followed by AZ and HI at 0.4%, followed by KS, VT, SD and WV at 0.5%.
This patchwork quilt of data may not be what you would have liked to have received this this July. However, staffing measures are here to stay. Paying attention to the data is critical. Accurate and timely submission PPJ (staffing) and MDS (Census and Acuity) data is the key to successful representation of your facility in this data.
If your staffing stars shine, way to go! In the current environment that is an accomplishment. Keep it up! This is data that you can use to compare your facility to your competitors, attract residents to your facility, remain in preferred provider networks and keep your managed care contracts. Don’t let up, the data sure won’t.
As COVID wanes, staffing may begin to improve. The data that affects the July numbers are from a specifically challenging year, 2021. We hope for brighter days ahead in skilled nursing and in the data. Perhaps the October refresh will bring good tidings.