On March 30th 2022 CMS updated the SNF value-based purchasing dataset. This updated both the baseline period, to 2018, and the performance period to 2019. (The actual performance period is April 1st through December 1st of 2019.)
It’s typically good news when new data is released. Readers of this blog know that we often call for additional, more timely release of data. HOWEVER, in this case, there are surprises in the data. The surprise being how much data CMS suppressed.
NONE of the facilities have VBP rankings, achievement scores or improvement scores. CMS explains this with:
CMS suppressed the use of SNF readmission measure data for purposes of FY 2022 scoring and payment adjustments in the FY 2022 SNF VBP Program year because the effects of the COVID-19 public health emergency on the data used to calculate the SNFRM inhibited CMS’s ability to make fair national comparisons of SNFs’ performance. Under the suppression policy, CMS calculated an RSRR for both the baseline and performance period and then suppressed the use of SNF readmission measure data for purposes of scoring. CMS instead assigned each SNF a performance score of 0.00000 to mitigate the effect that the COVID-19 public health emergency would otherwise have had on SNFs’ performance scores and incentive payment multipliers. The suppression policy was adopted in the FY 2022 SNF PPS final rule. Per this policy, each SNF received an identical incentive payment multiplier, and SNFs did not receive an achievement score, improvement score or rank. CMS then applied the low-volume adjustment policy as previously finalized in the FY 2019 SNF PPS final rule. If a SNF had fewer than 25 eligible stays during the baseline period (FY 2018), the baseline period RSRR was omitted. If a SNF had fewer than 25 eligible stays during the performance period (April 1, 2019, through December 1, 2019), the performance period RSRR was omitted and the SNF received a net-neutral incentive payment multiplier and performance score.
CMS
Fair enough.
For those of you who use the Med A Census Navigator™ app, you probably noticed when we updated the app after the data refresh, the readmission rate rankings all went to zero. (Download the app for iPhone or Android. It’s free.)
Notice the readmission ranking is zero. Boo.
Where do I rank?
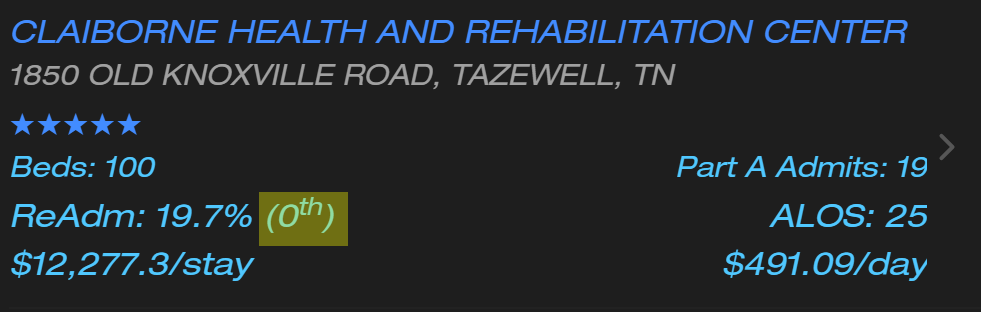
So how do you know where you rank if you see you have a readmission rate of 19.7%? It’s kind of a tricky question.
It’s tricky because only 10,707 of the 14,920 (71.7%) facilities actually have a performance period readmission rate. The rest have a note that says:
This facility had less than 25 eligible stays during the performance period. Therefore, this facility did not have sufficient data to calculate a performance period RSRR.
CMS
Okay, let’s ignore those facilities and take a look at the rest.
Here is a histogram you can use to get an idea where you stand versus the rest of the country. You can see a facility with a readmission rate of 19.7% is slightly better than the national average.
The green band is between the 25th and 75th percentiles. The lower orange band is the 10th to 25th percentile. The upper orange band is the 75th to 90th percentile.
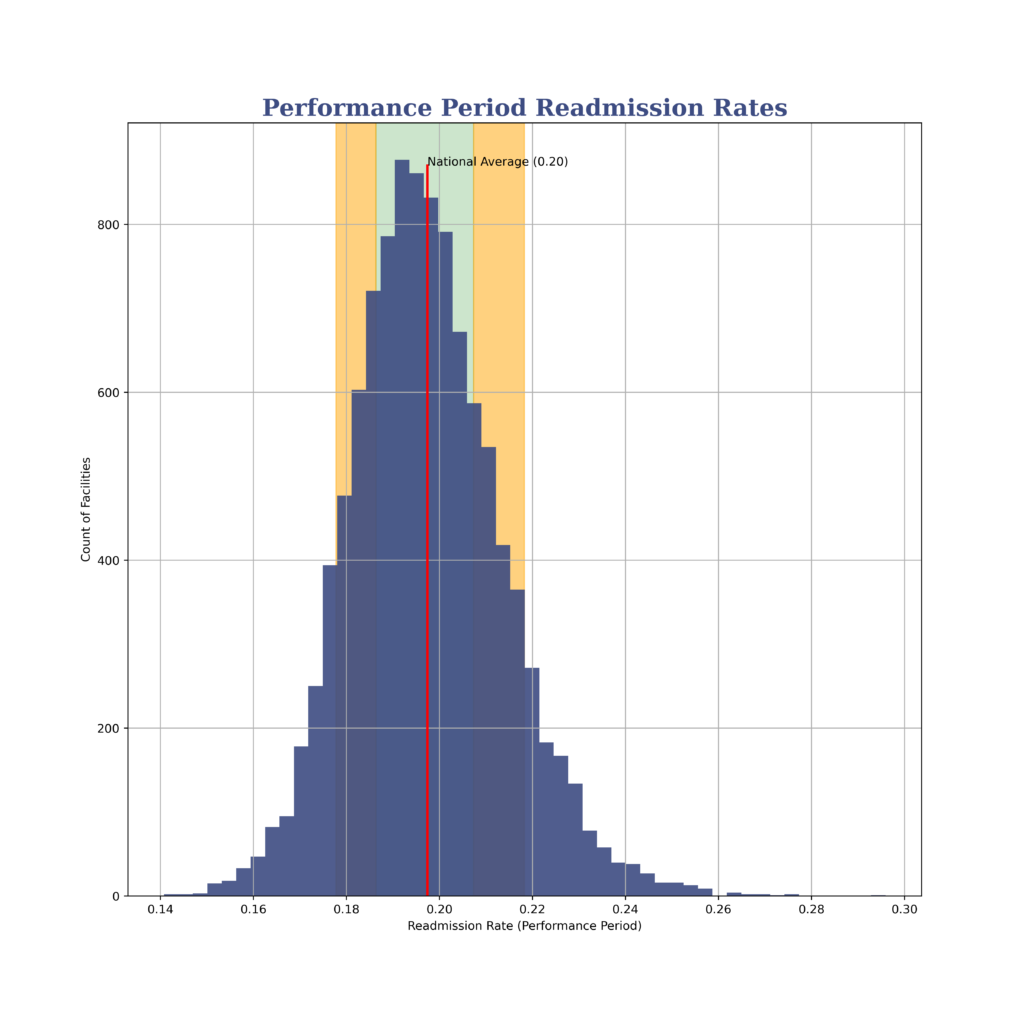
If you’re looking for exact percentiles, you’re my people. Here they are:
| Percentile | Readmission Rate |
|---|---|
| 10th | 17.8% |
| 25th | 18.6% |
| 50th | 19.6% |
| 75th | 20.7% |
| 90th | 21.8% |
Why didn’t you just put that in the app?
We try to make the app reflect CMS data as closely as possible. There are times when this can make things look… strange. This is one of those times. Those of you with the PRO version of the app are probably aware there are times when the $/day and $/stay look outrageous and unbelievable. The same reason applies: sometimes the data CMS supplies looks… strange. We present it without (many) comments.
Wait a Second…
The baseline is 2018. The performance period is 2019 and ends prior to December 2019. How is COVID-19 being used as a reason to suppress data?
Good question! Let’s get Joel VanEaton’s take on that.
Joel: In quarter 4 of 2019, CMS didn’t require providers to submit data for various reasons. Because of this, the performance period changed. That means there wasn’t a full year of data. Essentially, the reporting exceptions messed up the continuity of reporting.
CMS indicated,
“…the effects of the COVID-19 PHE on the data used to calculate the SNFRM inhibited CMS’s ability to make fair national comparisons of SNFs’ performance.”
CMS
Because of this, The FY 2022 Program year performance period was revised to Q2–Q4 CY 2019 and Q3 CY 2020 (4/1/2019—12/31/2019 and 7/1/2020—9/30/2020)
What else should people know about the recent changes to value-based purchasing?
Joel: Even with the supression of performance and rankings, providers still receive confidential feedback reports in their CASPER folders so they can see what ther performance was in the current reporting period.
It is also important to note that VBP will be changing significantly in the next few years. CMS has proposed several changes to value based purchasing having been given the authority to add up to nine new measures.
In the FY 2023 proposed rule, CMS is proposing to add a risk adjustment variable to the SNF RM, suppress the VBP performance scores and remove the low volume performer exception for FY 2023. They are also proposing to add three new quality measures:
- Healthcare Associated Infections
- Total Nurse Staffing to affect FY 2026 payments
- Discharge to the community to affect FY 2027 payments.