I love springtime. It is a time of renewal ,warm days and flowers blooming and often it is a time of new discoveries. Like the fact that I have discovered, that my lawn needs to be mowed and it’s only March.
Last month we blogged on state cut points and the disparities between the states. Since then, we have been making other interesting discoveries in the nursing home survey data. Today we’ll continue that work.
This month we’re digging deeper into the survey deficiencies themselves. Why is it seemingly easier to achieve a health inspection rating of 5 stars in certain states? Let’s start with a primer on how survey tags contribute to the health inspection rating.
Health Inspection Domain
- CMS calculates a health inspection score based on the three previous inspections and complaint inspections from the last three years. The final score includes focused infection control surveys too.
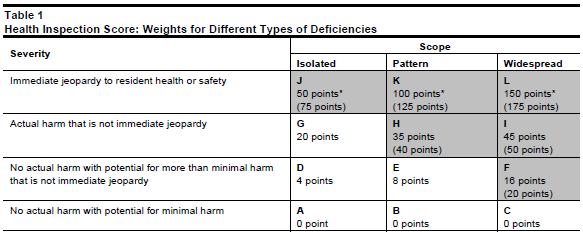
- The scope and severity of health deficiencies determine points. More serious, widespread deficiencies receive more points and additional points assigned for substandard quality of care. CMS calculates a total weighted health inspection score for each facility (including any repeat revisits). Lower scores are better. (See image below)
- CMS determines facility ratings using these criteria:
- The top 10 percent in each state receive a health inspection rating of five stars.
- The middle 70 percent splits equally into 2, 3 and 4 stars.
- The bottom 20 percent receive 1 star.
CMS recalibrates rating thresholds each month. This keeps the distribution of star ratings within states remains relatively constant over time. The state cut point table is here.
CMS Guidance to States
CMS provides guidance to states regarding health inspections. We talked about in a previous blog posting.
Health inspections are based on federal regulations, which surveyors implement using national interpretive guidance and a federally specified survey process.
Nursing Home Five-Star Quality Rating System: Technical Users’ Guide, January 2022
Standardized surveys are the goal throughout the country.
As we’ve already seen, the reality is different. Remember the cut points?
CMS understand and expects this.
Variation among states in the skill sets of inspectors, supervision of inspectors, and the inspection processes…
Nursing Home Five-Star Quality Rating System: Technical Users’ Guide, January 2022
That’s not comforting if you’re in a state where it is more difficult to achieve a 5-star rating.
State Data
Which tags do surveyors cite most across regions? States? Are the cited scopes and severities the same? Let’s look!
For starters, it is noteworthy and a little surprising that quality of life and care deficiencies are cited most. For instance, F-Tag citations make up 24.87% of the total number of tags over the last three survey cycles ending February 2022. Within that group of tags, F-Tag 689 (Ensure that a nursing home area is free from accident hazards and provides adequate supervision to prevent accidents) is the most frequently cited tag at 4.37%.
If we look at just J, K, and L scope and severity level within this group, now we see that Quality of life and care tags make up 39.25% of the citations, 19.60% of which are F-Tag 689.
Quality of Life and Care Deficiencies
Looking more closely within quality of life and care deficiencies we find there are significant differences in citation frequency among the 10 CMS regions .
Considering only the these tags cited at J, K, and L scope and severity, in region 7 (IA, KS, MO, NE), quality of life and care deficiencies are cited 54.42% of the time while in region 4 (AL, FL, GA, KY, MS, NC, SC, TN) they are cited only 27.04% of the time. In other words, if your nursing home is in region 7, you are much more likely to be cited for quality of life and care at J, K, L scope and severity than if you reside in region 4.
Interestingly, F-Tag 689 is cited at J, K, L, scope and severity 31.2% of the time in region 7 while in region 10 (AK, ID, OR, WA) it is cited only 14.3% of the time. If your are in region 7, you are much more likely to be cited for F689 at J, K, L than if you are in region 10.
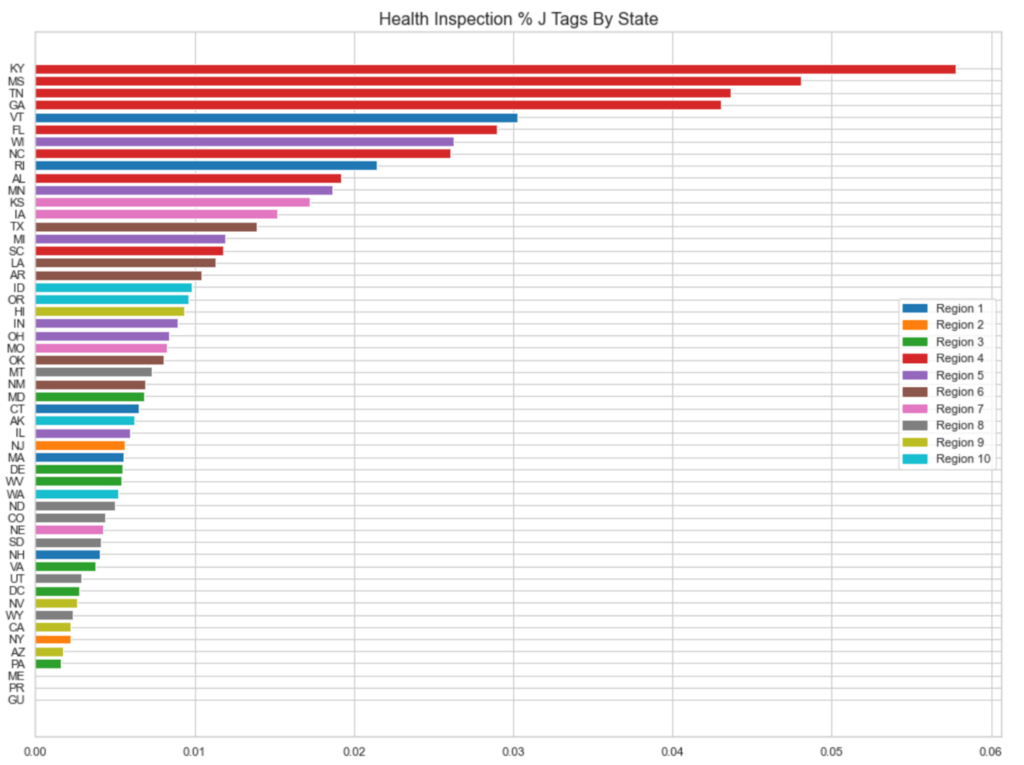
J Level Tags
Scope and severity drive cut points and star ratings. Here is an interesting look at J level scope and severity generally across all 10 CMS regions. You will note in the graph below that if your nursing home is located in region 4, you are much more likely to receive a J level scope and severity tag than other regions.
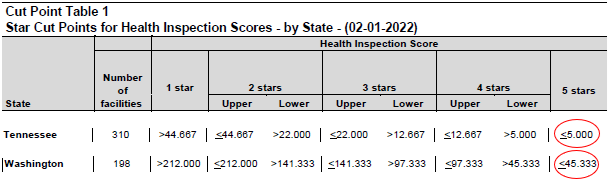
Furthermore, the state health inspection cut points reflect this. In the state cut point tables for Feb. 2022, you will notice that if you compare Tennessee, a region 4 state, and Washington, a region 10 state, the cut points are dramatically different. Note in the table below that a nursing home in Washington can score greater than 9x’s more composite points than a facility in Tennessee and still achieve 5 stars in their health inspection rating.
There are so many more of these interesting nuggets in the data that we could spend pages discussing it. However, for space and time’s sake here’s just one more interesting observation.
Infection Control
Infection control has been the hot button throughout the COVID PHE. In fact, for survey cycles through Feb. 2022, this group of tags comprised 9.10% of all tags cited and all scope and severity levels. Also, F-Tag 880 (Provide and implement an infection prevention and control program) was cited most often in this group at 7.53% of the time. If we look at these tags as a group at all scope and severity levels there is not much difference between states and regions.
However, if we drill down, once again to the J, K and L scope and severity, remember scope and severity drive the cut points, we find that there is great disparity between states and regions. In this context we see that infection control now occupies 15.46% of all deficiencies at this scope and severity range. We also see that F-Tag 880 now controls almost all these tags cited at 14.59%.
Furthermore, here the difference between the CMS regions could not be more distinct. If your nursing home is in region 8, (CO, MT, ND, SD, UT, WY) 33.1% of infection control tags are cited at J, K and L scope and severity. These are cited only 6.65% of the time in region 4. In other words, region 8 is much more likely to be cited for infection control at J, K and L scope and severity than region 4.
Put it into action
How can we use this information? First, be aware that survey focus varies from region to region and even state to state. For example, in region 4, while quality of life and care tags occupy the top citations at J, K, and L scope and severity, the next most cited tags at that scope and severity may surprise you. It is Freedom from abuse, neglect and exploitation deficiencies. That this is not the case in most other regions.
Mining this data is a practical window into how to best focus your resources for survey preparedness. It’s at least a glimpse. Who knows? The closer you look, you may be surprised at what new discoveries you make. How might these discoveries make a positive impact on your operations?